


Data release for "Reactor electron antineutrino disappearance in the Double Chooz experiment"
The publication is located here: arXiv:1207.6632
The information below is a supplement to the publication. Please reference the paper in case you use any of the information.
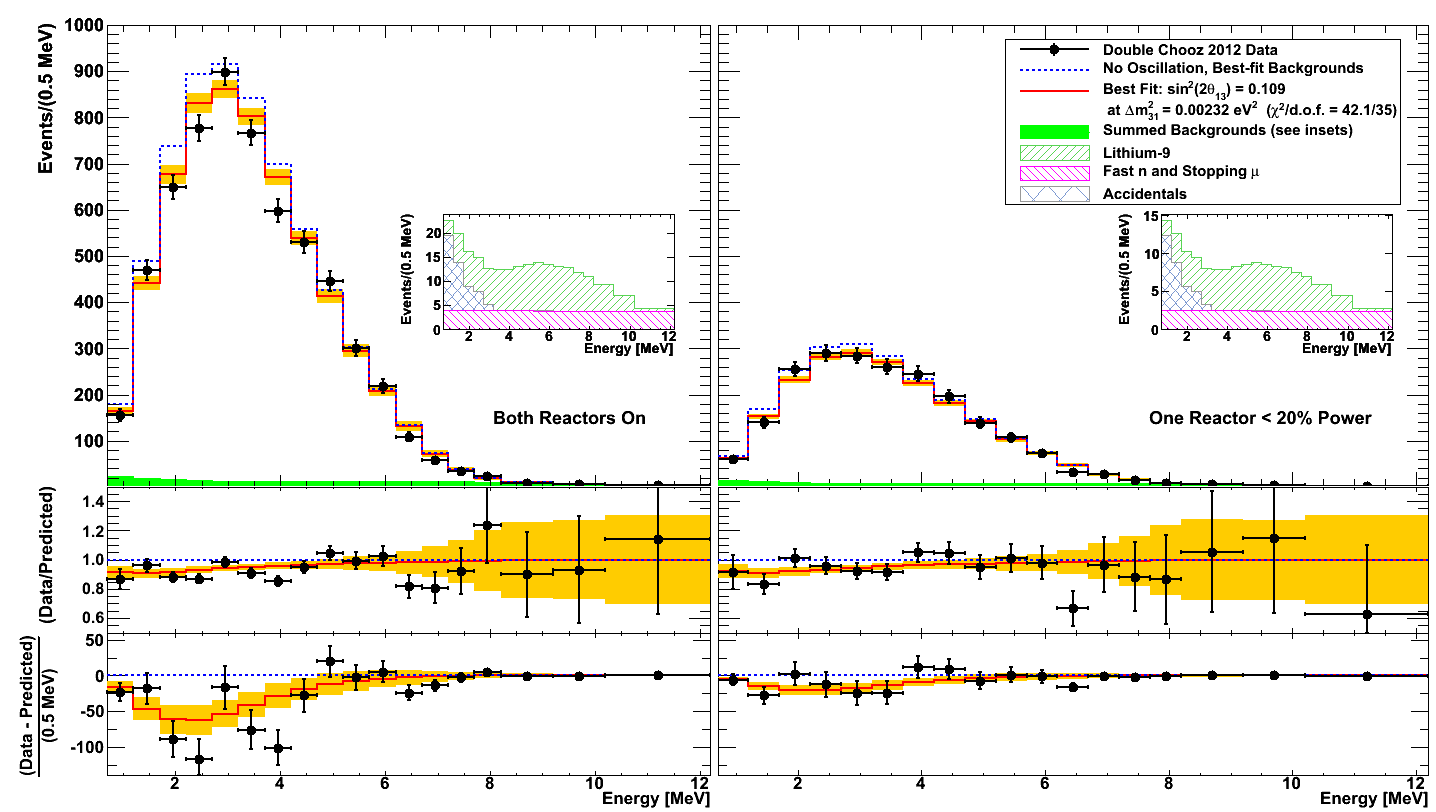
Text files containing the numerical values of the bin contents of each histogram in Figure 1 are given below. Note that bins cover two periods of data integration: two periods of 18 bins each, for 36 total bins. Bin populations are given in units of events per 0.5 MeV.
- Bin boundaries, in MeV: BinBoundaries.txt
- Binned IBD Candidate Data: DataVector.txt
- Best-fit signal: BestFit.txt
- Null-oscillation signal+background, with best-fit backgrounds: Unoscillated.txt
- Lithium-9 background at best-fit value: LithiumVector.txt
- Fast n and stopping muon background at best-fit value: FastNVector.txt
- Accidentals background: AccidentalVector.txt
Uncertainties on the signal and background predictions are represented using a covariance matrix. Matrices representing the systematic contributions from a number of sources are contained in the following ROOT-formatted file as TMatrixD objects. A total covariance matrix is also given. Details on the matrices are available in the README file accompanying the fitter package.
- Covariance Matrices: AbsoluteMatrices.root
The following materials can be used to reproduce the oscillation fit results. To use, unzip the archive file and follow instructions in the included README.